How to Read a Property Market Before You Buy: Three Australian Suburbs Compared
How to Read a Property Market Before You Buy: Three Australian Suburbs Compared
Written by

Darren Venter

Every property market in Australia is shaped by two core factors: the number of properties available and the level of buyer demand. Price movement follows from the relationship between these two forces. When supply is limited and demand remains strong, prices tend to rise. When new supply exceeds the level of active buyer demand, price growth can slow or, in some cases, decline.
The more important challenge is identifying this pattern at a suburb level before making an investment decision. At The Investors Agency, we use Crystal, a proprietary data platform that analyses more than 15,000 suburbs across Australia each month and tracks key buying and rental market conditions up to four years ahead.
Below, we examine three markets using Crystal’s data. Each one demonstrates a different way supply and demand can influence market performance, and what investors can learn from the data before they buy.
Market 1: Taylor, ACT - What happens when a developer floods a new suburb
Taylor, located just outside Canberra, was established as a new suburb from 2017. It provides a useful case study because the data shows what can happen when a large volume of new housing is released into a market within a short period.
New developments are typically priced at the upper end of what the surrounding market can support. This reflects the economics of development, where pricing needs to account for land acquisition, construction costs, margins, and market positioning. However, local household incomes are generally aligned with established property values in the broader area, rather than the premium price point at which new stock is released.
This can create a gap between the price of newly released homes and what local buyers can comfortably afford.
Crystal’s data on Taylor shows how this played out. From 2017 to 2022, property values declined back toward levels seen before the suburb was developed. This represented a five-year period of price adjustment. During that time, properties were spending longer on the market while new listings continued to enter, indicating that buyer demand was weaker than the volume of available stock.
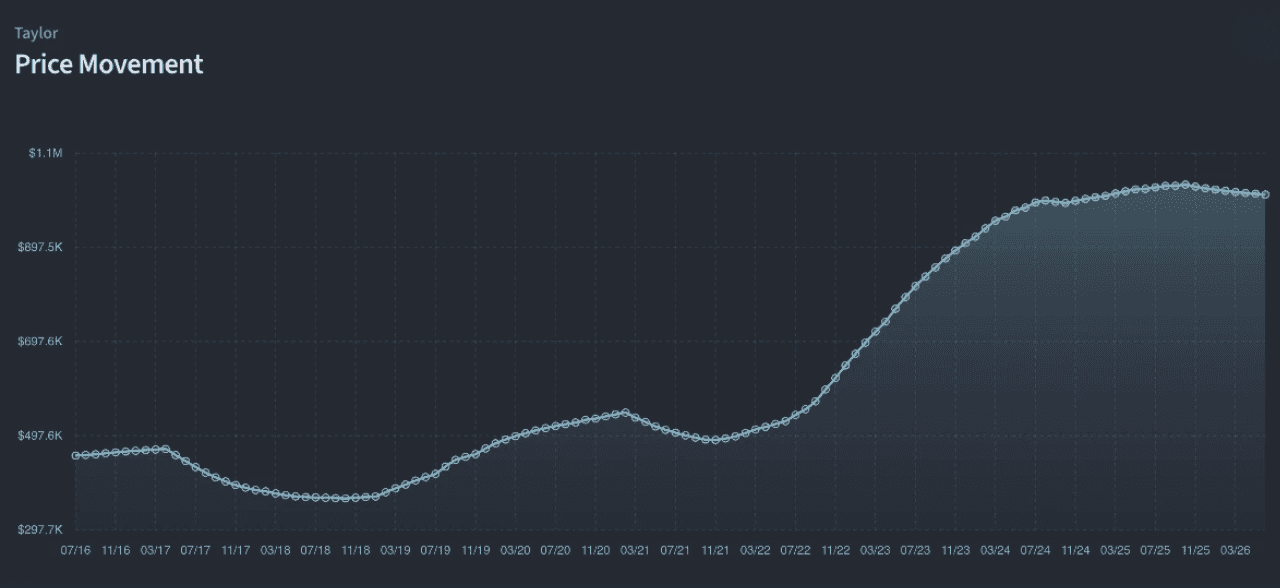
Around 2022, prices reached a level that was more closely aligned with local affordability. From that point, the rate at which homes were selling and the number of properties available began moving more consistently together, which is a sign of a more balanced market.
By late 2024, Taylor had again become expensive relative to local incomes. Prices increased from approximately $994,000 in September 2024 to around $1.04 million today, representing modest growth compared with the earlier market cycle. This suggests the market had moved ahead of what local buyers could comfortably support and required time to stabilise before the next phase of growth.
For investors, the key lesson is that buying a brand-new property at the point of developer release often means paying a premium price for that market. That premium can take years to recover. In Taylor’s case, the cost of entering at the wrong point in the cycle included five years of mortgage repayments, holding costs, and the opportunity cost of capital that may have performed more strongly in other markets.
Market 2: Munno Para West, SA - What a healthy market actually looks like
Munno Para West is located on the northern fringe of Adelaide, South Australia. Over the past four years, the suburb has recorded property price growth of 97%, with the data showing several key factors behind this performance.
For a suburb to sustain healthy growth, four indicators need to move in balance: the number of homes available for sale, the speed at which properties are selling, price movement, and local affordability. When these factors rise and fall at a similar pace, it suggests the market is growing at a level the local community can continue to support. Munno Para West has demonstrated this pattern consistently.
In 2023, local buyers required approximately 29% of household income to afford a home in the area. Today, that figure is around 36%.
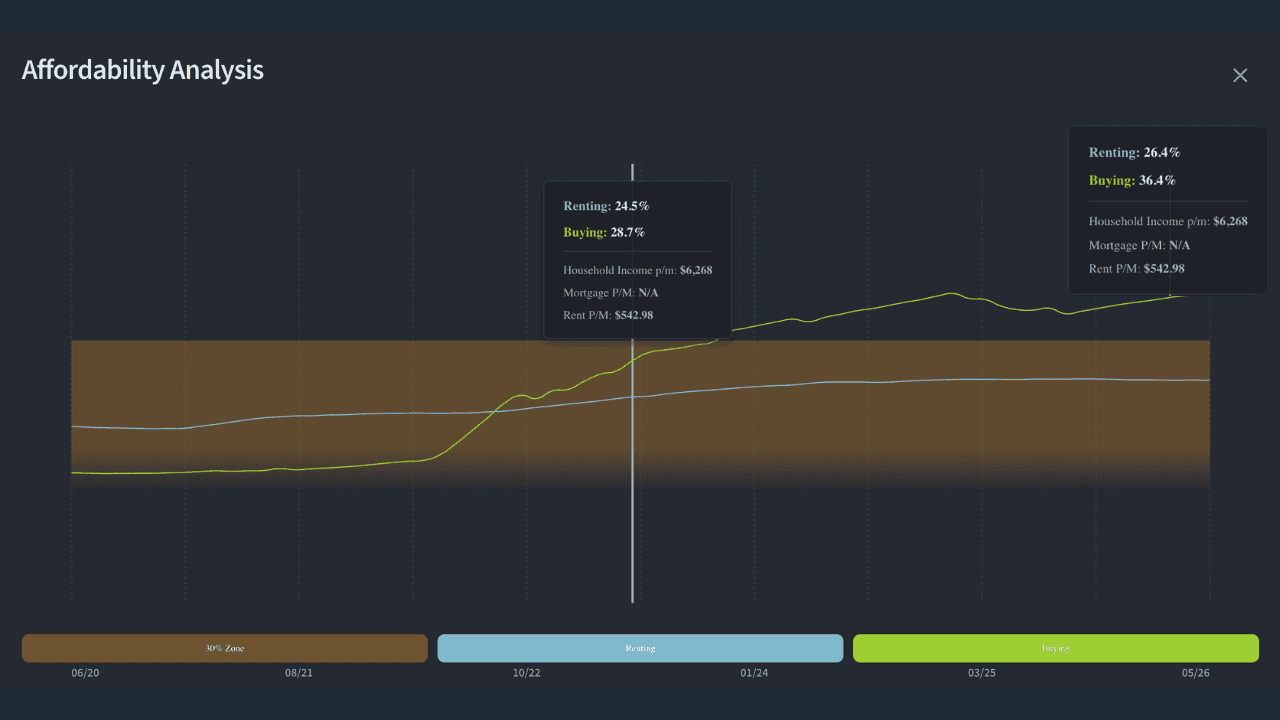
Over the same period, property prices increased by 97%. The fact that affordability has shifted by only seven percentage points while values have nearly doubled suggests local wages have risen alongside prices. This points to growth being supported by a strengthening local economy, rather than simply by buyer competition alone.

Adelaide’s inner-city employment growth has been a key driver of this market. As job creation strengthens across the city, the benefits can flow through to fringe suburbs such as Munno Para West, supporting local wage growth and helping maintain affordability even as property values rise.
In Munno Para West, the gap between vendor expectations and final sale prices remains narrow. This indicates steady buyer demand, without the level of overheating that can push prices beyond what the local market can sustainably support.
Vacancy rates are currently around 1%, with rental properties typically leasing within 21 days of becoming available. These conditions point to a healthy market for both investors and owner-occupiers.
This is the type of suburb Crystal is designed to identify: a market where property values still have room to grow within local affordability limits, wage growth supports further price movement, rental demand remains strong, and momentum is already evident.
Market 3: Port Augusta, SA - A starting point for investors with a smaller budget
Port Augusta is a different kind of market, and worth understanding on its own terms.
You can enter this market for around $50,000. The median price four years ago was approximately $157,000, and today it sits around $290,000, an 88% increase over that period.
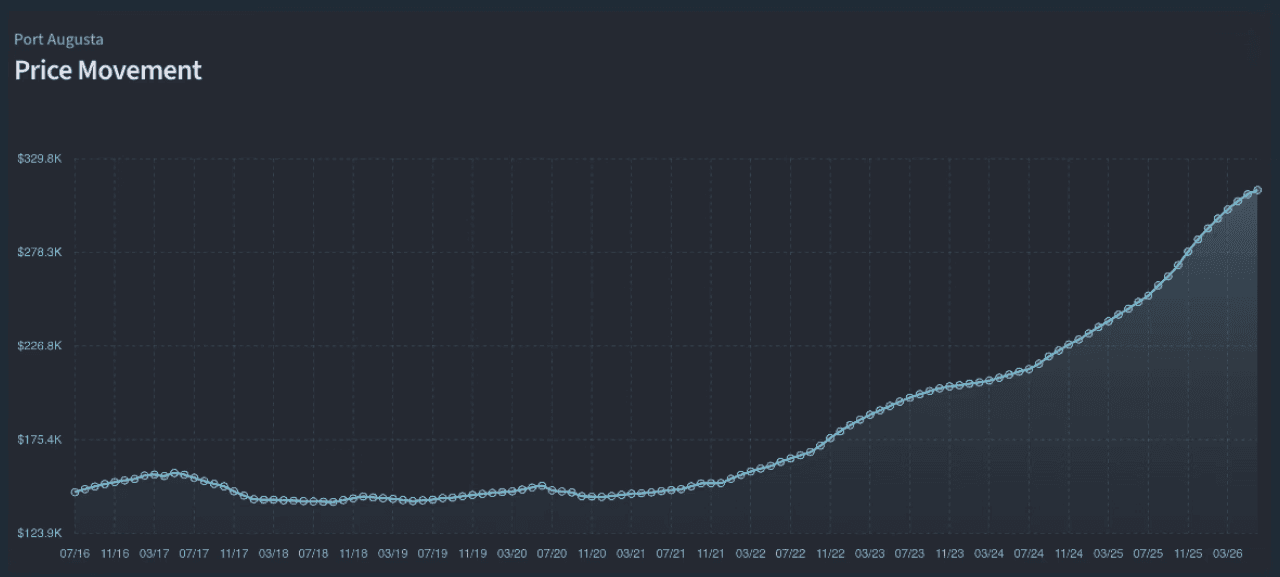
The numbers look strong by the basic measures: homes are selling faster and fewer are sitting on the market, rental vacancies sit at 2% (below the 3% level that indicates more renters than available properties), and rental properties are typically leased within 23 days.
Port Augusta’s economy is strongly influenced by fly-in fly-out (FIFO) employment, with many workers travelling to the region for roles in the energy sector and related industries before returning to their primary place of residence.
As a result, housing demand is closely tied to activity within these industries. When employment and project activity are strong, demand for accommodation tends to increase. When activity slows, demand can soften.
This also means Port Augusta may be less likely to experience the type of long-term gentrification seen in more diverse economies, where higher-income residents move into an area, increase local spending, and contribute to broader improvements in amenity and perception. In Port Augusta, the workforce is largely transient by design, which can limit the depth and consistency of long-term owner-occupier demand.
For investors entering the market with a smaller budget, a location like this may offer the potential to build equity more quickly than many higher-priced alternatives. The 88% growth recorded over four years suggests that investors may be able to access increased equity through refinancing, using it as a deposit for a subsequent property without triggering capital gains tax, as no sale has occurred.
The strategy is to use a lower-priced, higher-growth market as a stepping stone toward acquiring property in a more established location. However, this type of market is best approached as an entry point rather than a long-term set-and-forget investment.
It requires close monitoring of local industry activity, vacancy rates, rental demand, and market liquidity. Investors should also have a clear exit strategy, including a plan for when to sell and redeploy capital into the next acquisition.
What to look for before you buy in any market
Each of these three markets was assessed using the same core indicators. Together, they help show whether a suburb is supported by sustainable demand or whether growth may be starting to weaken.
Vacancy rate
Vacancy rate measures the percentage of rental properties sitting empty at a given point in time. A vacancy rate below 3% generally indicates that rental demand is stronger than available supply. Below 2% suggests a very tight rental market. When vacancy rises above 3%, it can indicate that rental conditions are beginning to soften.
How quickly homes are selling
The number of days a property spends on the market is a useful indicator of buyer demand. When homes are selling faster than they were six months earlier, buyer competition is typically increasing. When properties are taking longer to sell, demand may be easing.
How many homes are listed for sale
The number of properties available for sale shows the level of supply in the market. When listings are falling while properties are also selling faster, both supply and demand are moving in favour of price growth. This combination can be a strong signal of market momentum.
What local buyers can afford
Affordability is critical to sustainable growth. If property prices rise faster than local wages, the market can eventually reach a ceiling. Munno Para West shows the type of pattern investors should look for: prices rising alongside local incomes, rather than moving beyond what buyers can reasonably support.
Where the suburb sits in its cycle
Property markets generally move through growth, stabilisation, and adjustment phases. The goal is to identify a market early in its growth phase, build equity while momentum is strong, and avoid entering too late in the cycle. Crystal tracks where each suburb sits within its market cycle across more than 13,000 suburbs each month.
If you want more certainty before choosing your next investment location, speak with the team at The Investors Agency to see how Crystal helps identify markets with stronger growth potential.
Watch our latest video
See how we use Crystal, our proprietary predictive analytics platform, to assess supply, demand, affordability and future growth potential across three Australian markets.
You’ll see:
A Canberra development that took five years to recover its original value
A fringe Adelaide suburb that has grown 97% in four years
A regional South Australian market with a low entry point, higher risk and a specific investor use case
Watch the episode to see how the data helps investors understand what may happen next.
Chapters
0:00 Why supply and demand is all that actually matters
1:00 Crystal: How The Investors Agency reads market data four years out
2:01 Market 1: Taylor ACT - What new stock does to a suburb's value
5:37 Market 2: Munno Para West SA - Why this one grew 97%
9:20 Market 3: Port Augusta SA - The $50k entry point explained
13:01 The metrics every investor should be tracking.
Every property market in Australia is shaped by two core factors: the number of properties available and the level of buyer demand. Price movement follows from the relationship between these two forces. When supply is limited and demand remains strong, prices tend to rise. When new supply exceeds the level of active buyer demand, price growth can slow or, in some cases, decline.
The more important challenge is identifying this pattern at a suburb level before making an investment decision. At The Investors Agency, we use Crystal, a proprietary data platform that analyses more than 15,000 suburbs across Australia each month and tracks key buying and rental market conditions up to four years ahead.
Below, we examine three markets using Crystal’s data. Each one demonstrates a different way supply and demand can influence market performance, and what investors can learn from the data before they buy.
Market 1: Taylor, ACT - What happens when a developer floods a new suburb
Taylor, located just outside Canberra, was established as a new suburb from 2017. It provides a useful case study because the data shows what can happen when a large volume of new housing is released into a market within a short period.
New developments are typically priced at the upper end of what the surrounding market can support. This reflects the economics of development, where pricing needs to account for land acquisition, construction costs, margins, and market positioning. However, local household incomes are generally aligned with established property values in the broader area, rather than the premium price point at which new stock is released.
This can create a gap between the price of newly released homes and what local buyers can comfortably afford.
Crystal’s data on Taylor shows how this played out. From 2017 to 2022, property values declined back toward levels seen before the suburb was developed. This represented a five-year period of price adjustment. During that time, properties were spending longer on the market while new listings continued to enter, indicating that buyer demand was weaker than the volume of available stock.
Around 2022, prices reached a level that was more closely aligned with local affordability. From that point, the rate at which homes were selling and the number of properties available began moving more consistently together, which is a sign of a more balanced market.
By late 2024, Taylor had again become expensive relative to local incomes. Prices increased from approximately $994,000 in September 2024 to around $1.04 million today, representing modest growth compared with the earlier market cycle. This suggests the market had moved ahead of what local buyers could comfortably support and required time to stabilise before the next phase of growth.
For investors, the key lesson is that buying a brand-new property at the point of developer release often means paying a premium price for that market. That premium can take years to recover. In Taylor’s case, the cost of entering at the wrong point in the cycle included five years of mortgage repayments, holding costs, and the opportunity cost of capital that may have performed more strongly in other markets.
Market 2: Munno Para West, SA - What a healthy market actually looks like
Munno Para West is located on the northern fringe of Adelaide, South Australia. Over the past four years, the suburb has recorded property price growth of 97%, with the data showing several key factors behind this performance.
For a suburb to sustain healthy growth, four indicators need to move in balance: the number of homes available for sale, the speed at which properties are selling, price movement, and local affordability. When these factors rise and fall at a similar pace, it suggests the market is growing at a level the local community can continue to support. Munno Para West has demonstrated this pattern consistently.
In 2023, local buyers required approximately 29% of household income to afford a home in the area. Today, that figure is around 36%.
Over the same period, property prices increased by 97%. The fact that affordability has shifted by only seven percentage points while values have nearly doubled suggests local wages have risen alongside prices. This points to growth being supported by a strengthening local economy, rather than simply by buyer competition alone.
Adelaide’s inner-city employment growth has been a key driver of this market. As job creation strengthens across the city, the benefits can flow through to fringe suburbs such as Munno Para West, supporting local wage growth and helping maintain affordability even as property values rise.
In Munno Para West, the gap between vendor expectations and final sale prices remains narrow. This indicates steady buyer demand, without the level of overheating that can push prices beyond what the local market can sustainably support.
Vacancy rates are currently around 1%, with rental properties typically leasing within 21 days of becoming available. These conditions point to a healthy market for both investors and owner-occupiers.
This is the type of suburb Crystal is designed to identify: a market where property values still have room to grow within local affordability limits, wage growth supports further price movement, rental demand remains strong, and momentum is already evident.
Market 3: Port Augusta, SA - A starting point for investors with a smaller budget
Port Augusta is a different kind of market, and worth understanding on its own terms.
You can enter this market for around $50,000. The median price four years ago was approximately $157,000, and today it sits around $290,000, an 88% increase over that period.
The numbers look strong by the basic measures: homes are selling faster and fewer are sitting on the market, rental vacancies sit at 2% (below the 3% level that indicates more renters than available properties), and rental properties are typically leased within 23 days.
Port Augusta’s economy is strongly influenced by fly-in fly-out (FIFO) employment, with many workers travelling to the region for roles in the energy sector and related industries before returning to their primary place of residence.
As a result, housing demand is closely tied to activity within these industries. When employment and project activity are strong, demand for accommodation tends to increase. When activity slows, demand can soften.
This also means Port Augusta may be less likely to experience the type of long-term gentrification seen in more diverse economies, where higher-income residents move into an area, increase local spending, and contribute to broader improvements in amenity and perception. In Port Augusta, the workforce is largely transient by design, which can limit the depth and consistency of long-term owner-occupier demand.
For investors entering the market with a smaller budget, a location like this may offer the potential to build equity more quickly than many higher-priced alternatives. The 88% growth recorded over four years suggests that investors may be able to access increased equity through refinancing, using it as a deposit for a subsequent property without triggering capital gains tax, as no sale has occurred.
The strategy is to use a lower-priced, higher-growth market as a stepping stone toward acquiring property in a more established location. However, this type of market is best approached as an entry point rather than a long-term set-and-forget investment.
It requires close monitoring of local industry activity, vacancy rates, rental demand, and market liquidity. Investors should also have a clear exit strategy, including a plan for when to sell and redeploy capital into the next acquisition.
What to look for before you buy in any market
Each of these three markets was assessed using the same core indicators. Together, they help show whether a suburb is supported by sustainable demand or whether growth may be starting to weaken.
Vacancy rate
Vacancy rate measures the percentage of rental properties sitting empty at a given point in time. A vacancy rate below 3% generally indicates that rental demand is stronger than available supply. Below 2% suggests a very tight rental market. When vacancy rises above 3%, it can indicate that rental conditions are beginning to soften.
How quickly homes are selling
The number of days a property spends on the market is a useful indicator of buyer demand. When homes are selling faster than they were six months earlier, buyer competition is typically increasing. When properties are taking longer to sell, demand may be easing.
How many homes are listed for sale
The number of properties available for sale shows the level of supply in the market. When listings are falling while properties are also selling faster, both supply and demand are moving in favour of price growth. This combination can be a strong signal of market momentum.
What local buyers can afford
Affordability is critical to sustainable growth. If property prices rise faster than local wages, the market can eventually reach a ceiling. Munno Para West shows the type of pattern investors should look for: prices rising alongside local incomes, rather than moving beyond what buyers can reasonably support.
Where the suburb sits in its cycle
Property markets generally move through growth, stabilisation, and adjustment phases. The goal is to identify a market early in its growth phase, build equity while momentum is strong, and avoid entering too late in the cycle. Crystal tracks where each suburb sits within its market cycle across more than 13,000 suburbs each month.
If you want more certainty before choosing your next investment location, speak with the team at The Investors Agency to see how Crystal helps identify markets with stronger growth potential.
Watch our latest video
See how we use Crystal, our proprietary predictive analytics platform, to assess supply, demand, affordability and future growth potential across three Australian markets.
You’ll see:
A Canberra development that took five years to recover its original value
A fringe Adelaide suburb that has grown 97% in four years
A regional South Australian market with a low entry point, higher risk and a specific investor use case
Watch the episode to see how the data helps investors understand what may happen next.
Chapters
0:00 Why supply and demand is all that actually matters
1:00 Crystal: How The Investors Agency reads market data four years out
2:01 Market 1: Taylor ACT - What new stock does to a suburb's value
5:37 Market 2: Munno Para West SA - Why this one grew 97%
9:20 Market 3: Port Augusta SA - The $50k entry point explained
13:01 The metrics every investor should be tracking.
Ready to start your high growth property journey?
Ready to start your high growth property journey?
Ready to start your high growth property journey?
Learn about how we build a property strategy tailored to your individual profile by booking a FREE consultation call.